


Story Visualizations Released
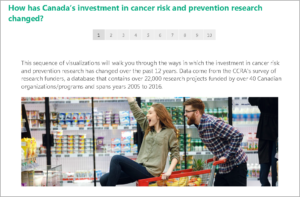 As companions to our 2016 special topic reports, CCRA has released interactive ‘story visualizations’ using Tableau software. Story visualizations are dashboards that are linked sequentially. They walk users through a series of analyses, each with greater detail, and allowing users more opportunity to ‘interact’ with the data. We welcome your feedback!
To access these tools, click here.
CCRC 2021 Pre-Conference Survey
We want to hear from you on how to make this year’s Canadian Cancer Research Conference (CCRC) a meaningful and unique experience!
To ensure the success of our first-ever virtual conference this November, we are asking all those who are interested in attending to take 3-5 minutes to complete a short survey sharing your interests and feedback. The results of this survey will be used to inform the format, delivery, and scientific content of the conference to make the event as valuable, engag... Read More »
CCRA congratulates Canadian researchers on receiving prestigious awards
 The CCRA extends its congratulations to members of the Canadian cancer research community for receiving several distinguished awards for biomedical research and scientific excellence in recent days, including:
- John E. Dick, PhD, FRS, FRsC, FAACR, recipient of the Canada Gairdner International Awar... Read More »
The CCRA extends its congratulations to members of the Canadian cancer research community for receiving several distinguished awards for biomedical research and scientific excellence in recent days, including:
- John E. Dick, PhD, FRS, FRsC, FAACR, recipient of the Canada Gairdner International Awar... Read More »